Asian Countries Import Data – List of Top Asian Importer Countries
11 August 2020
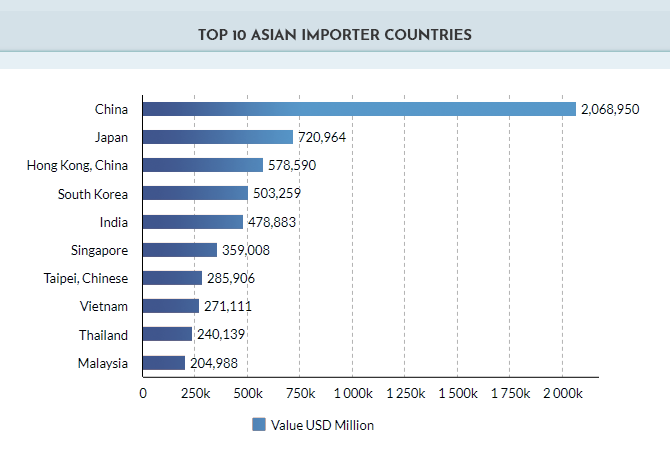
Asian countries imported
goods worth USD 7,111 billion in 2019, decline from 2018’s USD 7,499 billion.
According to Asia import data,
countries in Asian continent accounted for 37.3% to overall value of import
shipments recorded in last year. China stood as the largest importer country in
Asia, which shared 10.9% of total import value of commodities imported by
countries in Asian continent. Check list of top Asian exporter countries with
Asia import statistics.
|
Rank |
Importer
Country |
Value USD
Million |
|
1. |
2,068,950 |
|
|
2. |
720,964 |
|
|
3. |
Hong Kong, China |
578,590 |
|
4. |
503,259 |
|
|
5. |
478,883 |
|
|
6. |
Singapore |
359,008 |
|
7. |
Taipei, Chinese |
285,906 |
|
8. |
271,111 |
|
|
9. |
240,139 |
|
|
10. |
Malaysia |
204,988 |
|
11. |
200,658 |
|
|
12. |
170,727 |
|
|
13. |
112,908 |
|
|
14. |
53,326 |
|
|
15. |
50,134 |
|
|
16. |
38,356 |
|
|
17. |
Myanmar |
25,978 |
|
18. |
21,867 |
|
|
19. |
Cambodia |
20,279 |
|
20. |
16,503 |
What Does Top 5 Countries in Asia Import?
China is the largest importer country in the Asian continent, while it
is second largest country in global imports. Out of 37.3% of Asia’s imports in
the world, China shared 10.9% in 2019. Here is a list of top 5 Asian importer
countries with their top import products and major import partners.
1.
China
China’s Top 10 Imports: Electronics (24%), Mineral Fuels & Oils
(16.6%), Machinery (9.2%), Ores, Slag & Ash (7.9%), Optical, Photographic,
Medical Equipment (4.7%), Vehicles (3.6%), Plastics (3.4%), Pearls & Precious
Stones (2.9%), Organic Chemicals (1.9%) and Copper & Articles (1.9%).
China’s Major Import Partners: South Korea (8.4%), Taipei (8.4%), Japan
(8.3%), United States (6%) and Australia (5.8%).
2.
Japan
Japan’s Top 10 Imports: Mineral Fuels & Oils (21.6%), Electronics
(13.7%), Machinery (9.78%), Optical, Photographic, Medical Equipment (3.92%),
Pharma Products (3.78%), Vehicles (3.3%), Ores, Slag & Ash (3.08%),
Plastics (2.24%), Organic Chemicals (2.23%) and Not Knitted Apparel &
Clothing (1.98%).
Japan’s Major Import Partners: China (23.5%), United States (11.3%),
Australia (6.3%), South Korea (4.1%) and Saudi Arabia (3.8%).
3.
Hong Kong, China
Hong Kong’s Top 10 Imports: Electrical Machinery & Equipment
(53.18%), Machinery (11.47%), Pearls & Precious Stones (9.38%), Optical,
Photographic, Medical Equipment (3.05%), Mineral Fuels & Oils (2.49%),
Plastics (1.43%), Clocks & Watches (1.39%), Essential Oils & Resinoids
(1.11%), Meat (0.93%) and Knitted or Crocheted Apparel & Clothing (0.91%).
Hong Kong’s Major Import Partners: China (45.7%), Taipei (7.3%), Singapore
(6.5%), Japan (5.8%) and South Korea (4.9%).
4.
South Korea
South Korea’s Top 10 Imports: Mineral Fuels & Oils (25.29%),
Electrical Machinery & Equipment (17.82%), Machinery (10.26%), Optical,
Photographic, Medical Equipment (3.67%), Vehicles (3.32%), Iron & Steel
(3.11%), Ores, Slag & Ash (3%), Organic Chemicals (2.52%), Plastics (2.29%)
and Miscellaneous Chemical Products (1.62%).
South Korea’s Major Import Partners: China (21.3), United States (12.3), Japan
(9.5), Saudi Arabia (4.3) and Vietnam (4.2).
5.
India
India’s Top 10 Imports: Mineral Fuels & Oils (31.98%), Pearls
& Precious Stones (12.5%), Electronics (10.5%), Machinery (9.18%), Organic
Chemicals (4.28%), Plastics (3.05%), Iron & Steel (2.41%), Animal or
Vegetable Fats & Oils (2%), Optical, Photographic, Medical Equipment
(1.98%) and Fertilizers (1.53%).
India’s Major Import Partners: China (14.2%), United States (7.2%), United
Arab Emirates (6.4%), Saudi Arabia (5.6%) and Iraq (4.5%).
Asia is the world’s largest continent, which shared 37.3% of global
imports. Out of which, the top 10 Asian importer countries accounted for 30% to
overall value of shipments in 2019. Get very latest updates on import &
export scenario of any country right here.