India's Basmati Rice Exports Price Might Increase Amid Red Sea Attacks
04 January 2024
Due to the constant attacks on various cargo ships and
commercial vehicles passing through the Red Sea region, Indian shipping
companies have rerouted the shipments containing one of India’s top exported
cereals—Basmati Rice (HS Code 10063020).
The Indian agencies and authorities have claimed that this rerouting of
shipments containing the cereal can lead to the rise in prices of basmati rice
to export to partner countries, and could affect exports, mainly to Middle
Eastern and European countries.
India’s Basmati
Rice Exports
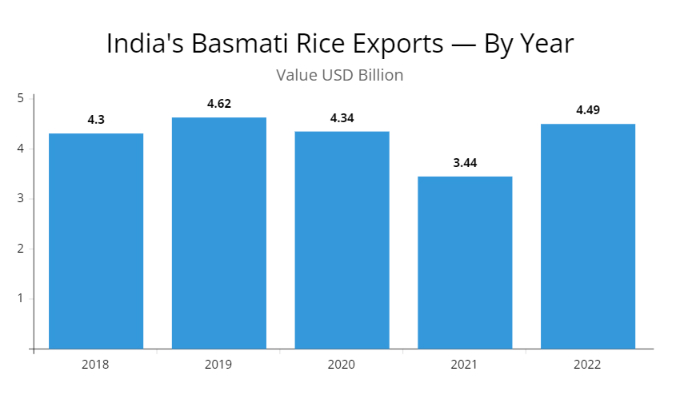
India’s basmati rice exports in the past five years
have fluctuated. The exports of basmati rice from India to its partner
countries registered—$4.3 billion in 2018, followed by $4.6 billion in 2019,
$4.3 billion in 2020, $3.4 billion in 2021, and $4.4 billion in 2022.
|
India's Basmati Rice Exports — By Year |
|
|
Year |
Value USD Billion |
|
2018 |
4.30 |
|
2019 |
4.62 |
|
2020 |
4.34 |
|
2021 |
3.44 |
|
2022 |
4.49 |
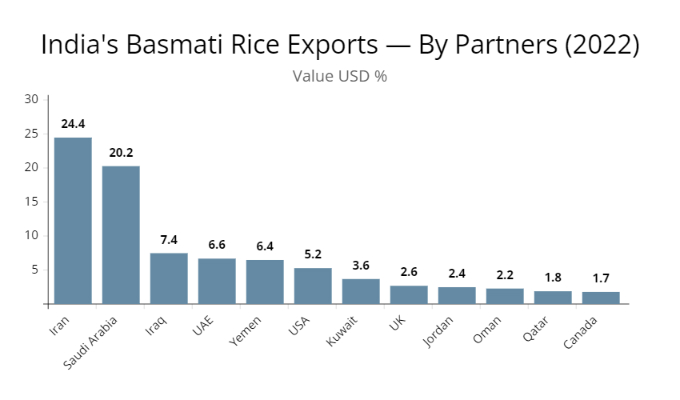
India’s top exporting partners for basmati rice
are—Iran (24.4%), Saudi Arabia (20.2%), Iraq (7.4%), the United Arab Emirates
(6.6%), Yemen (6.4%), the United States of America (5.2%), Kuwait (3.6%), the
United Kingdom (2.6%), Jordan (2.4%), Oman (2.2%), Qatar (1.8%), and Canada
(1.7%).
|
India's Basmati Rice Exports — By Partners (2022) |
|
|
Country |
Value USD % |
|
Iran |
24.4 |
|
Saudi Arabia |
20.2 |
|
Iraq |
7.4 |
|
United Arab Emirates |
6.6 |
|
Yemen |
6.4 |
|
United States of America |
5.2 |
|
Kuwait |
3.6 |
|
United Kingdom |
2.6 |
|
Jordan |
2.4 |
|
Oman |
2.2 |
|
Qatar |
1.8 |
|
Canada |
1.7 |
India’s Basmati
Rice Exports To Europe
India’s basmati exports to Europe increased in 2022,
following a decline in 2021. These exports to Europe have fluctuated in the
past five years, registering—$216.2 million in 2018, $230.3 million in 2019,
$309.5 million in 2020, $251.1 million in 2021, and $268.8 million in 2022.

|
India's Basmati Rice Exports To Europe — By Year |
|
|
Year |
Value USD Million |
|
2018 |
216.22 |
|
2019 |
230.30 |
|
2020 |
309.54 |
|
2021 |
251.15 |
|
2022 |
268.83 |
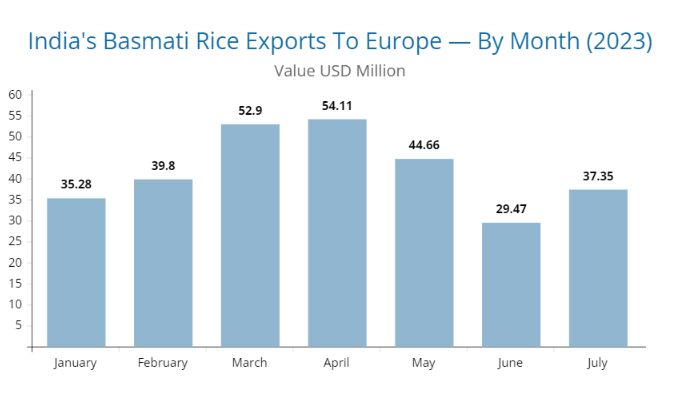
The recent exports of India’s basmati rice to Europe
in monthly trends of the year 2023 show these values: $35.2 million in January,
$39.8 million in February, $52.9 million in March, $54.1 million in April,
$44.6 million in May, $29.4 million in June, $37.3 million in July.
|
India's Basmati Rice Exports To Europe — By Month
(2023) |
|
|
Month |
Value USD Million |
|
January |
35.28 |
|
February |
39.80 |
|
March |
52.90 |
|
April |
54.11 |
|
May |
44.66 |
|
June |
29.47 |
|
July |
37.35 |
India’s Basmati
Rice Exports To Middle East
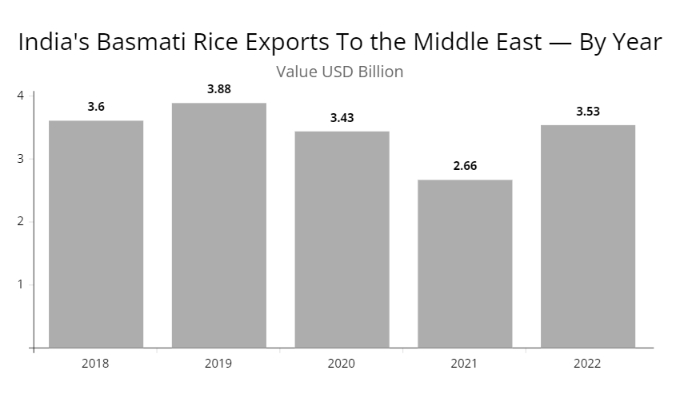
India’s basmati rice exports to the Middle East have
fluctuated in the past five years, registering—$3.6 billion in 2018, $3.8
billion in 2019, $3.4 billion in 2020, $2.6 billion in 2021, and $3.5 billion
in 2022. The exports of Indian basmati rice to the Middle East surged in 2022
falling in 2021.
|
India's Basmati Rice Exports To the Middle East — By
Year |
|
|
Year |
Value USD Billion |
|
2018 |
3.60 |
|
2019 |
3.88 |
|
2020 |
3.43 |
|
2021 |
2.66 |
|
2022 |
3.53 |
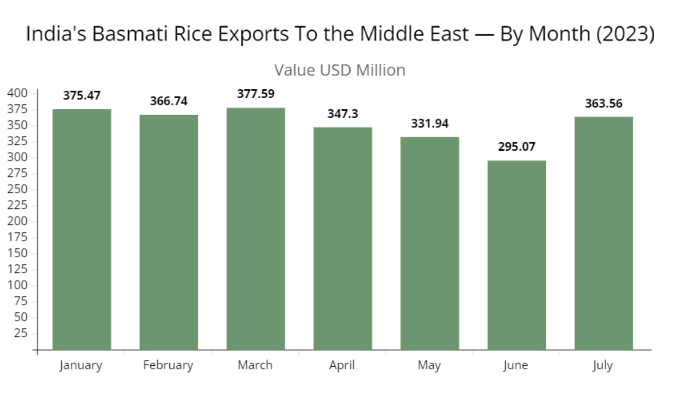
India’s basmati rice exports to the Middle East in the
recent months of 2023 have shown these values: $375.4 million in January,
$366.7 million in February, $377.5 million in March, $347.3 million in April,
$331.9 million in May, $295 million in June, $363.5 million in July.
|
India's Basmati Rice Exports To the Middle East — By
Month (2023) |
|
|
Month |
Value USD Million |
|
January |
375.47 |
|
February |
366.74 |
|
March |
377.59 |
|
April |
347.30 |
|
May |
331.94 |
|
June |
295.07 |
|
July |
363.56 |
The reroute of Indian shipments containing basmati
rice through the Red Sea allows for a convenient transfer of goods from India
to its top exporting partners such as the United States of America and the
European countries.
The Indian suppliers and authorities have claimed that
due to the frequent bans on different commodities that are farm-grown including
wheat, rice, and sugar, the exports of other farm commodities are important to
neutralize the ban effects on the export values.