India’s Exports Increased by 60% in March 2021 – India Export Data
28 April 2021

India’s exports in March 2021
increased by 60% and stood at USD 34.45 billion, as compared to USD 21.49
billion in March last year. As per Export Genius India export data, the
positive growth in exports has put the overall trade deficit for April-March
2020-21 to estimated USD 12.74 billion as compared to the deficit of USD 77.76
billion in April-March 2019-20.
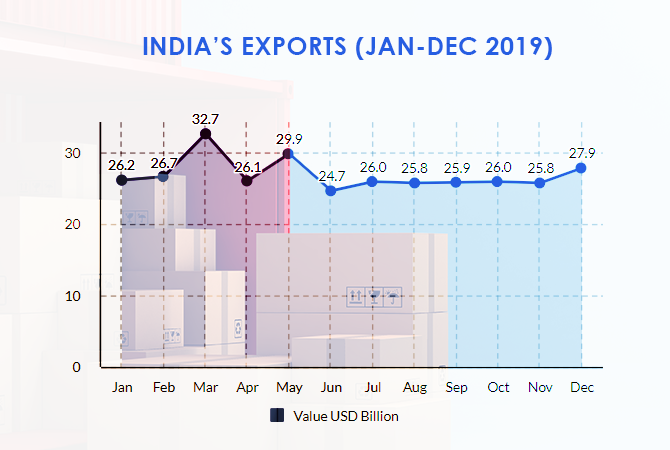
India’s Exports (Jan-Dec 2019)
As per India export data,
India’s exports totaled USD 323.2 billion in 2019, a slight decline from USD
323.9 billion recorded in 2018. If we see month-wise value of goods exported by
India in 2019, we found that the highest value of export shipments was recorded
in March month, when the figures crossed USD 32 billion mark. Otherwise, India
reported more than USD 25 billion export value in other months of 2019. Take a
look at dollar amount of goods exported by India from Jan to Dec 2019.
|
Month |
Value
USD Billion |
|
Jan |
26.2 |
|
Feb |
26.7 |
|
Mar |
32.7 |
|
Apr |
26.1 |
|
May |
29.9 |
|
Jun |
24.7 |
|
Jul |
26.0 |
|
Aug |
25.8 |
|
Sep |
25.9 |
|
Oct |
26.0 |
|
Nov |
25.8 |
|
Dec |
27.9 |
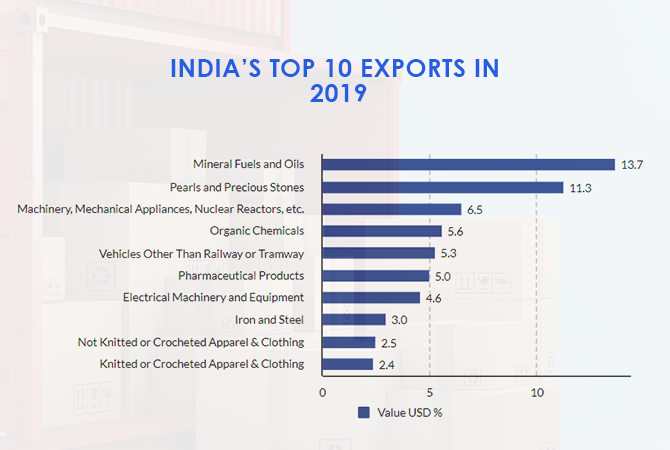
India’s Top 10 Exports in 2019
India export statistics show
India shipped mineral fuels & oils the most in 2019, followed by pearls
& precious stones. The dollar amount of India’s top 10 exports in 2019 are
mineral fuels & oils (USD 44.5 billion), pearls & precious stones (USD
36.7 billion), machinery, mechanical appliances, nuclear reactors, etc. (USD
21.2 billion), organic chemicals (USD 18.2 billion), vehicles other than
railway or tramway (USD 17.4 billion), pharmaceutical products (USD 16.2
billion), electrical machinery & equipment (USD 14.9 billion), iron &
steel (USD 9.7 billion), not knitted or crocheted apparel & clothing (USD
8.3 billion) and knitted or crocheted apparel & clothing (USD 7.8 billion).
As per India customs data,
these export categories accounted for 59.9% to overall value of shipments
depart from the country in 2019 through all modes of transport. See value in
percentile of India’s top 10 export commodities reported in 2019 and analyze
how India is doing in export business.
|
Product |
Value
USD % |
|
Mineral
Fuels and Oils |
13.7 |
|
Pearls
and Precious Stones |
11.3 |
|
Machinery,
Mechanical Appliances, Nuclear Reactors, etc. |
6.5 |
|
Organic
Chemicals |
5.6 |
|
Vehicles
Other Than Railway or Tramway |
5.3 |
|
Pharmaceutical
Products |
5.0 |
|
Electrical
Machinery and Equipment |
4.6 |
|
Iron
and Steel |
3.0 |
|
Not
Knitted or Crocheted Apparel & Clothing |
2.5 |
|
Knitted
or Crocheted Apparel & Clothing |
2.4 |
The year 2020 was bad in terms
of trade for not only India but countries around the world and 2021 seems to be
economy recovery year but at slow rate as the global countries are still fighting
against Covid-19 pandemic. The United States, India and Brazil are the worst
affected countries by coronavirus.