India's Toy Imports Drop, Exports Surge; Shows Promising Self-Reliance
19 July 2022
India imports for toys and games dropping this year,
while exports are skyrocketing with gradual growth. It has been all possible
due to the initiative taken by the government of India under “Make-In-India”
campaign name. The total imports of toys, sports, and games (Chapter 95) in
India amounted to $380.27 million for 2021. On the other hand, the total
exports from India for toys, sports, and games in 2021 amounted to $516.51
million.
Top Exports By India – By Commodity
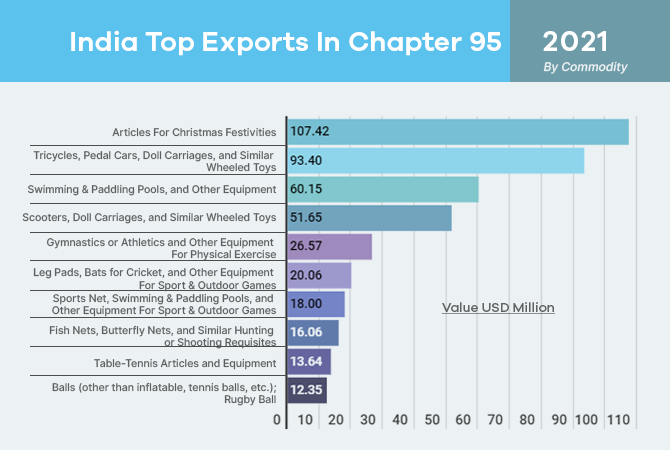
The top exports from India for toys, games, and sports
(Chapter 95) in 2021 are—Christmas Festivities’ Articles ($107.4M), Wheeled
Toys ($93.4M), Swimming Equipment ($60.1M), Other Wheeled Toys ($51.6M), and
Equipment for Physical Exercise ($26.5M).
Other notable exports from India for toys, sports
equipment, and games in 2021 are—Leg Pads & Cricket Bats ($20.0M), Sports
Net ($18.0M), Fish Nets ($16.0M), Table-Tennis Accessories ($13.6M), and Rugby
Ball ($12.3M).
|
India Top Exports
In Chapter 95 (2021) – By Commodity |
|
|
Commodity |
Value USD Million |
|
Articles For Christmas
Festivities |
107.42 |
|
Tricycles, Pedal Cars, Doll
Carriages, and Similar Wheeled Toys |
93.40 |
|
Swimming & Paddling Pools,
and Other Equipment |
60.15 |
|
Scooters, Doll Carriages, and
Similar Wheeled Toys |
51.65 |
|
Gymnastics or Athletics and
Other Equipment For Physical Exercise |
26.57 |
|
Leg Pads, Bats for Cricket, and
Other Equipment For Sport & Outdoor Games |
20.06 |
|
Sports Net, Swimming &
Paddling Pools, and Other Equipment For Sport & Outdoor Games |
18.00 |
|
Fish Nets, Butterfly Nets, and
Similar Hunting or Shooting Requisites |
16.06 |
|
Table-Tennis Articles and
Equipment |
13.64 |
|
Balls (other than inflatable,
tennis balls, etc.); Rugby Ball |
12.35 |
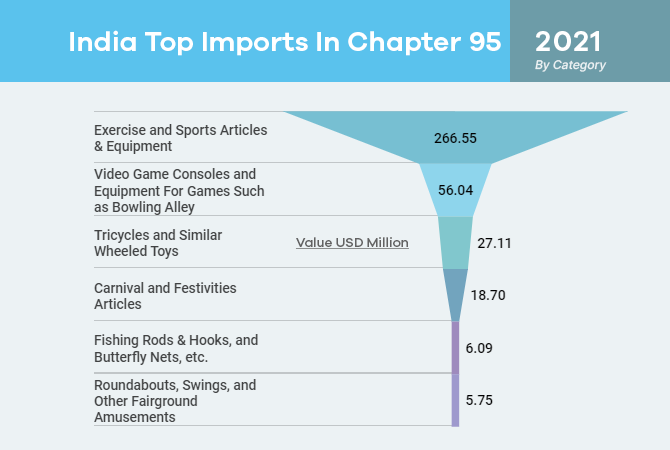
Top Imports By
India – By Category
The top imports by India for toys, sports, and games
in 2021 are—Exercise & Sports Equipment ($266.5M), Video Game Consoles
& Casual Games Equipment ($56.0M), Wheeled Toys ($27.1M), Festivities
Articles ($18.7M), Hunting or Shooting Requisites ($6.0M), and Fairground
Amusements ($5.7M).
|
India Top Imports
In Chapter 95 (2021) – By Category |
|
|
Category |
Value USD Million |
|
Exercise and Sports Articles
& Equipment |
266.55 |
|
Video Game Consoles and
Equipment For Games Such as Bowling Alley |
56.04 |
|
Tricycles and Similar Wheeled
Toys |
27.11 |
|
Carnival and Festivities
Articles |
18.70 |
|
Fishing Rods & Hooks, and
Butterfly Nets, etc. |
6.09 |
|
Roundabouts, Swings, and Other
Fairground Amusements |
5.75 |
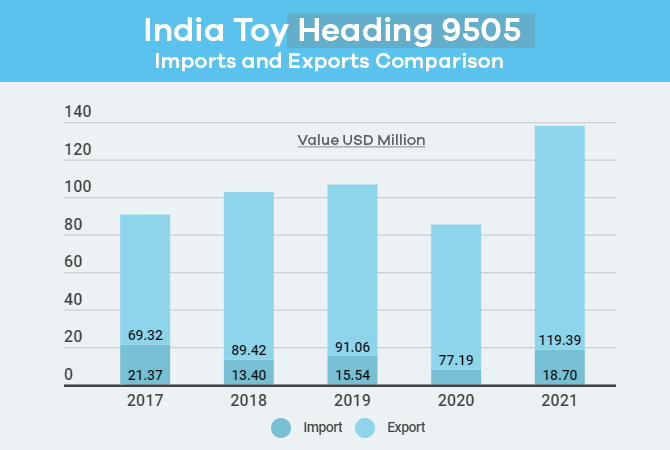
Import and
Export Comparison (Heading 9505)
The below table shows the comparison between the
imports and exports of India for products consisting of Heading 9505. Heading
9505 consists of “Festivities/Entertainment Articles”. The data is segregated
into yearly values and shows corresponding import and export for each year.
The imports in the below table are fluctuating,
beginning from 2018 to 2020, starting from a value of $21.3 million to $7.9
million. The imports in 2021 amounted to $18.7 million, showing a growth in the
imports.
|
India Toys [Heading
9505] – Imports and Exports Comparison |
||
|
Year |
Value USD Million (Import) |
Value USD Million (Export) |
|
2017 |
21.37 |
69.32 |
|
2018 |
13.40 |
89.42 |
|
2019 |
15.54 |
91.06 |
|
2020 |
7.91 |
77.19 |
|
2021 |
18.70 |
119.39 |
The exports for the featured products from India grew
frequently with significant values, starting from a value of $69.3 million in
2017 to $91.0 million in 2019. In 2020, the export value declined by 15.2% and
stood at $77.1 million. However, in 2021, values increased by 54.6% ($119.3M).
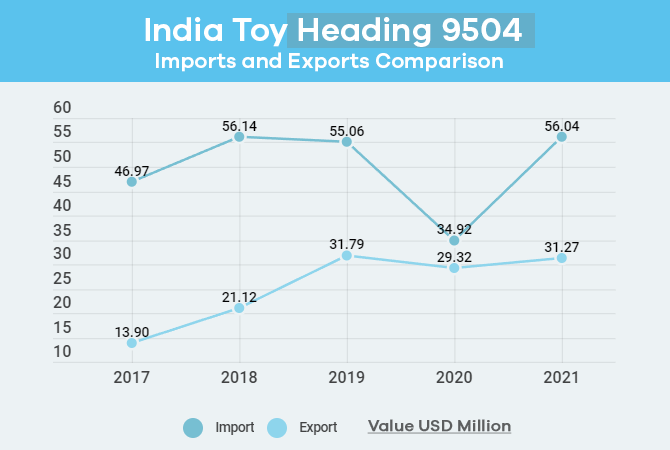
Import and
Export Comparison (Heading 9504)
The below table shows the comparison between the
import and export of India for the products falling under the HS Code
Classification of Heading 9504, i.e., “Video Game Consoles & Machines, and
Casual Games Equipment”, on the basis of yearly values, from 2017 to 2021.
The imports in 2017 are lower compared to the values
in 2018 and 2019—$46.9 million for 2017, $56.1 million and $55 million for 2018
and 2019 respectively. Imports fell in 2020 by 36.5% but grew by 60.4%,
standing at a value of $56.0 million.
|
India Toy [Heading
9504] – Imports and Exports Comparison |
||
|
Year |
Value USD Million (Import) |
Value USD Million (Export) |
|
2017 |
46.97 |
13.90 |
|
2018 |
56.14 |
21.12 |
|
2019 |
55.06 |
31.79 |
|
2020 |
34.92 |
29.32 |
|
2021 |
56.04 |
31.27 |
The exports in 2017 are lower than compared to the
values in 2018 and 2019—$13.9 million for 2017, $21.1 million and $31.7 million
for 2018 and 2019 respectively. Exports too fell in 2020 by 7.7% but accounted
for a growth in the export value of 2021 by 6.6%, standing at $31.2 million.
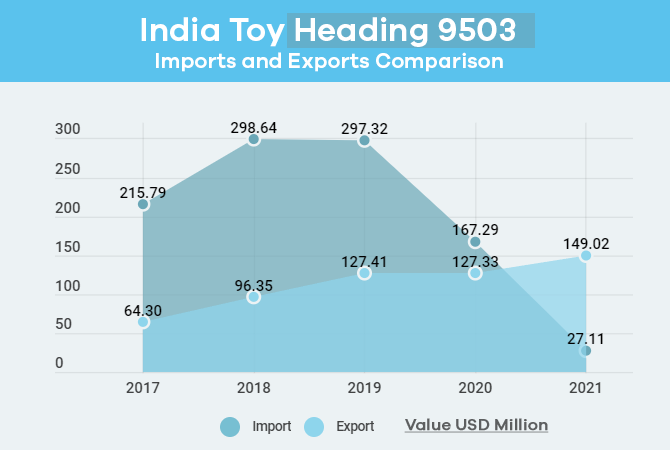
Import and
Export Comparison (Heading 9503)
The below table shows the comparison between the
import and export of India for the commodities falling under Heading 9503 –
“Tricycles, Doll Carriages, and Similar Wheeled Toys”. The values are
segregated into the yearly basis for both imports and exports.
The imports in 2017 started off with a lower value of
$215.7 million as compared to the values of 2018 and 2019, i.e., $298.6 million
and $297.3 million respectively. In 2020, the values dropped by 43.73% with a
value of $167.2 million. In 2021, imports further declined by 83.7% ($27.1M).
|
India Toy [Heading
9503] – Imports and Exports Comparison |
||
|
Year |
Value USD Million (Import) |
Value USD Million (Export) |
|
2017 |
215.79 |
64.30 |
|
2018 |
298.64 |
96.35 |
|
2019 |
297.32 |
127.41 |
|
2020 |
167.29 |
127.33 |
|
2021 |
27.11 |
149.02 |
The exports in 2017 started off with a lower value of $64.3 million as compared to the values of 2018 and 2019, i.e., $96.3 million and $127.4 million respectively. In 2020, the values declined by a minor drop of 86.9 thousand US dollars. In 2021, exports grew by 17.03% ($149.02M).
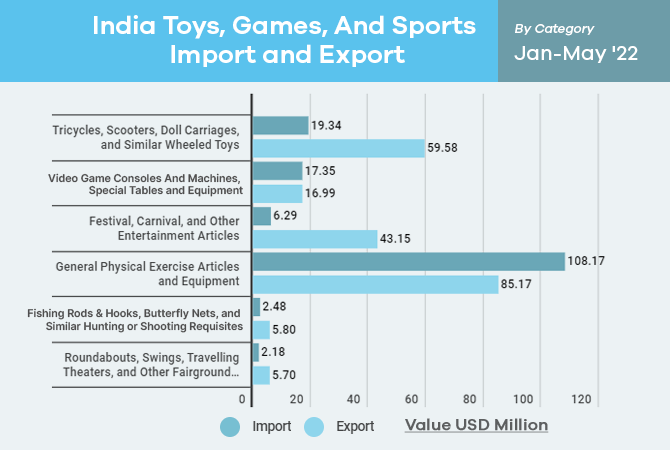
India Imports
and Exports In 2022
India’s imports and exports for toys, games, and
sports—Chapter 95 by India, are shown below in the table, following a time
period of 5 months from January to May in 2022. The shown products are
segregated into the categories of products, and are not the exact commodity.
The imports of articles and equipment for general
physical exercises accounted for the highest amount of imports with an import
value of $108.17 million, followed by the imports of tricycles, and similar
products with a value of $19.34 million. The total imports amount to $155.8
million.
|
India Toys, Games,
And Sports Import and Export – By Category (Jan-May '22) |
||
|
Category |
Value USD Million (Import) |
Value USD Million (Export) |
|
Tricycles, Scooters, Doll
Carriages, and Similar Wheeled Toys |
19.34 |
59.58 |
|
Video Game Consoles And
Machines, Special Tables and Equipment |
17.35 |
16.99 |
|
Festival, Carnival, and Other
Entertainment Articles |
6.29 |
43.15 |
|
General Physical Exercise
Articles and Equipment |
108.17 |
85.17 |
|
Fishing Rods & Hooks,
Butterfly Nets, and Similar Hunting or Shooting Requisites |
2.48 |
5.80 |
|
Roundabouts, Swings, Travelling
Theaters, and Other Fairground Amusements |
2.18 |
5.70 |
The exports of articles and equipment for general
physical exercises accounted for the highest exports among all the categories,
with an export value of $85.17 million. The values of exports for tricycles and
similar wheeled toys are of significance, standing at $59.58 million of worth.
While the total value of imports in 2022 so far
amounted to $155.8 million, the total export value amounted to $216.43 million.
The difference between imports and exports stood at a value of $60.58 million,
with a percentage of 38.87%, signifying an increasing value for exports.
The government of India is constantly growing into its
domain of self-reliance under the campaign of “Make-In-India” by promoting
locally manufactured goods and encouraging domestic manufacturers to boost both
the quantity and quality of production.