India's Trade Deficit Hit An Eight-Month Low Count
08 June 2021

India’s trade deficit, as seen in the data officially
released on Wednesday, appears high as domestic demand for several goods and
services surged. Preliminary data released by the Commerce and Industry
Ministry showed the trade deficit of May 2021 widened to $6.32 Billion from the
previous year trade deficit of May 2020 as $3.62 Billion. India import export
data shows that imports of the country in the year 2021 have risen up much
faster than previous year as domestic demand and demand for raw materials as
well is on the top.
Trade deficit falling to an eight-month low is aided
by the limited domestic demand for gold, oils and other products, considering
the second wave of COVID-19 and lockdown in several states. Exports for the
majority of products remain virtually unchanged for the country. The exported
products because of which exports are robust in this month are petroleum
products, engineering goods, gems and jewelry, etc. Buy our exclusive import
and export data of India inclusive of different commodities and trade insights;
or request a sample to look for your requirement of the trade data from Export
Genius.
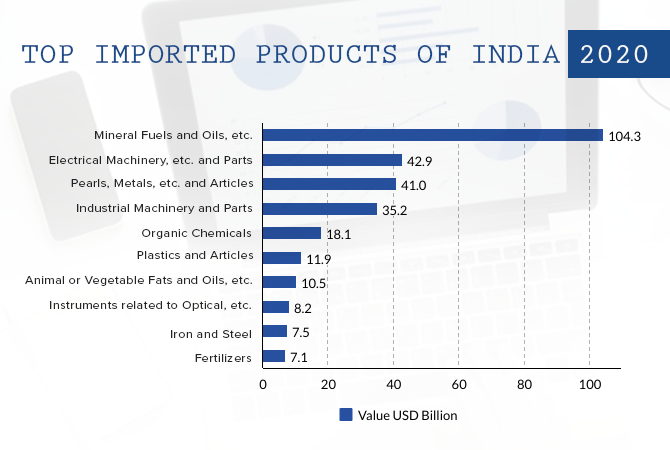
India’s Trade Deficit and Imports
2020
India’s trade deficit, however, was the lowest since
September 2020 at $2.7 Billion. It was 62.49% lower than the trade deficit of
May 2019 standing at $16.84 Billion. As we can see in the trade data of India
2020, the top imported products of India in 2020 were: Mineral Fuels and Oils
with the highest import value of $104.3 Billion, followed by Electronics and
Parts with an import value of $42.9 Billion, Pearls, Stones, and Metals with a
value of $41 Billion, Industrial Machinery and Parts with a value of $35.2
Billion, Organic Chemical with a value of $18.1 Billion, and more. Look at the
import data for top imported products of India in 2020 and observe. Get more
information on India’s mineral fuels and oil imports and
other commodities.
|
HS Code |
Product |
Value USD Billion |
|
27 |
Mineral Fuels and Oils, etc. |
104.3 |
|
85 |
Electrical Machinery and
Equipment, etc. and Parts |
42.9 |
|
71 |
Pearls, Stones and Metals, etc.
and Articles |
41.0 |
|
84 |
Industrial Machinery (Mechanical
Appliances, Nuclear Reactors, Boilers, etc.) and Parts |
35.2 |
|
29 |
Organic Chemicals |
18.1 |
|
39 |
Plastics and Articles |
11.9 |
|
15 |
Animal or Vegetable Fats and
Oils, etc. |
10.5 |
|
90 |
Instruments and Apparatus
related to Optical, Medical and more |
8.2 |
|
72 |
Iron and Steel |
7.5 |
|
31 |
Fertilizers |
7.1 |
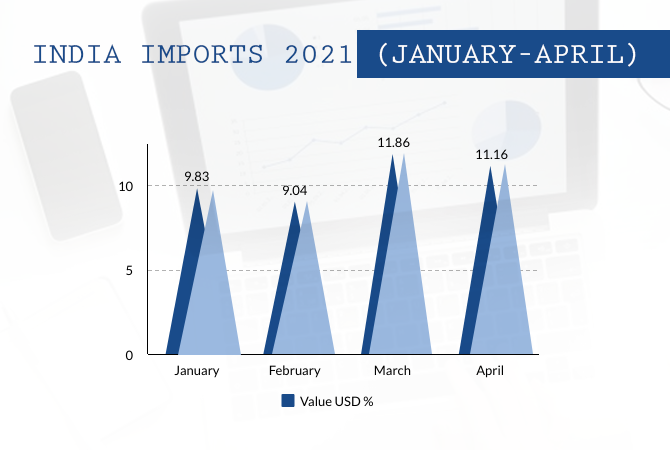
India’s Trade Deficit and Increasing
Imports
India import and export data shows that India exports
grew by 195.7% in April this year. In May 2021, India’s exports rose by 67.39%
year-on-year to $32.21 Billion, while imports grew by 68.54% to $38.53 Billion
from $16.84 last year. Import data of India shown below indicates the rising
imports for a time period of January 2021–April 2021. Due to lack of
statistical data, till April the value of imports are represented here. Value
of imports are shown in share value by percentage of each month’s contribution
to overall imports. Look at the India import data below. Search live data from here and look for your preferable range of import export
data of India.
|
Month |
Value USD % |
|
January |
9.83 |
|
February |
9.04 |
|
March |
11.86 |
|
April |
11.16 |
Although, the India import data 2021 above shows the
decline of imports, but it is only in the April month. Since the arrival of the
second wave of the pandemic, the demand for many raw materials and medical
supplies have risen up. As aforementioned, the month of May has recorded a
trade deficit widened to $6.32 billion in May 2021 from $3.62 billion in May
2020, as per the official data released by the Commerce and Industry Ministry
on Wednesday. Get exclusive information on importers and exporters of India
along with information on international trade of several commodities from
Export Genius, and grow your prospects — and business.