India-China Bilateral Trade – Study of Trade Flows of India and China
16 March 2023

The trade between India and China reached USD 142,594
million (exports to China: USD 15,743 million and imports from China: USD
126,851 million) in 2022, an increase from USD 117,387 million (exports to
China: USD 20,982 million and imports from China: USD 96,405 million) reported
in 2021. According to our report, India-China trade is forecasted to go down
and be USD 139,442 million in 2023.
This is due to India’s ‘Make In India’ initiative that
will help companies to manufacture goods, instead of buying from China. In the
Union Budget 2023-24, the government has extended the PLI scheme in other
sectors that will provide incentives to domestic industries to boost local
production. Still, India has a long road to go as it is majorly dependent on
imports of Chinese goods for meeting the local demand. Here is an in-depth
analysis of India-China bilateral trade with statistics and forecasts.
India’s Trade Deficit with China
2021 and 2022
Although India is adopting several measures including its ‘Make In India’ initiative to reduce dependency on imports from China, India records a trade deficit with China. According to a market research report, India’s trade deficit in 2021 was USD -75423 million in 2021 which increased to USD -111107 million in 2022. Look at the trade balance of India with China.

|
India-China Trade |
2021 (USD Million) |
2022 (USD Million) |
|
India Exports to China |
20,982 |
15,743 |
|
India Imports from China |
96,405 |
126,851 |
|
Trade Balance |
-75,423 |
-111,107 |
India’s ‘Make In India’ Initiative
Since the launch of ‘Make In India’ scheme in 2014,
India has been on the edge of shaping the country’s manufacturing hub. Take a
look at the impact of Aatmanirbhar Bharat Abhiyan, Make In India, and the
Production-Linked Incentive (PLI) over all these years.
Impact of the Make In India Scheme
·
Attracting
Record FDI Inflow
In the first year of the ‘Make In India’ scheme,
Foreign Direct Investment (FDI) inflows stood at US$ 45.15 billion. The year
2021-22 recorded the highest-ever FDI at US$ 83.6 billion and India is on track
to attract US$ 100 billion FDI in the current financial year.
·
Improving
Toy Exports and Reducing Imports
To reduce the import of foreign-made toys and enhance
the ability to manufacture toys domestically, the government increased the
Basic Customs Duty on the import of toys from 20% to 60%. The import of toys in
FY21-22 has reduced by 70% to US$ 110 million (Rs 877.8 crore), compared to
imports worth US$ 371 million (Rs 2,960 crore) in 2018-19.
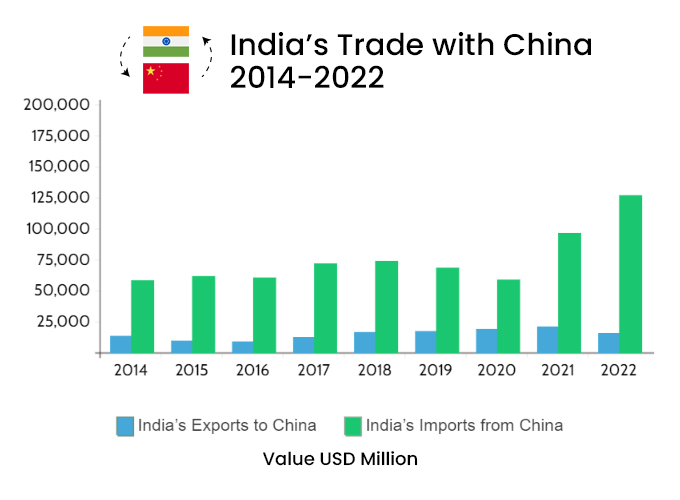
Exports: Make In India
India reached US$ 418 billion in manufacturing exports in FY22 with rapid growth over the last 2 years. By 2028, it is expected that India will reach 1 trillion in manufacturing goods for exports. The chart given below shows India’s trade with China from 2014 when ‘Make In India’ was launched.
|
Year |
India’s Exports to China
(Value USD Million) |
India’s Imports from
China (Value USD Million) |
|
2014 |
13,434 |
58,230 |
|
2015 |
9,539 |
61,641 |
|
2016 |
8,914 |
60,479 |
|
2017 |
12,500 |
71,890 |
|
2018 |
16,503 |
73,845 |
|
2019 |
17,278 |
68,402 |
|
2020 |
19,008 |
58,798 |
|
2021 |
20,982 |
96,405 |
|
2022 |
15,743 |
126,851 |
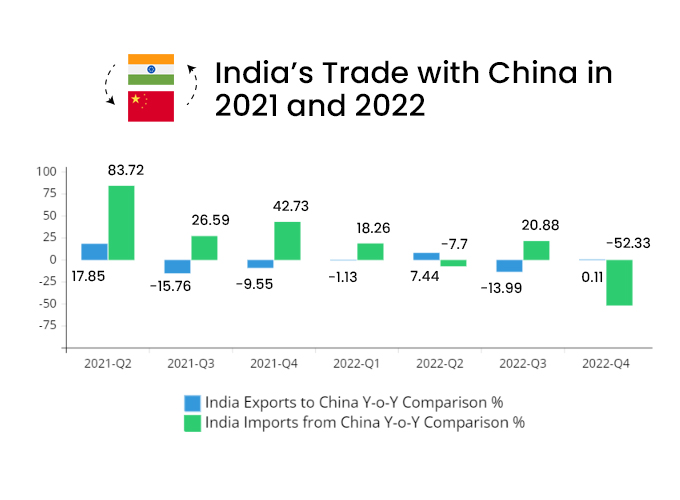
India’s Trade with China in 2021
and 2022
In the 2021-Q1-2022-Q4 period, India’s trade with
China increased. Exports to China saw a decline while imports from China
reported an increase due to India’s dependency on Chinese goods. According to a
market research report, the total value of India’s exports to China was USD
4,933 million in Q1 of 2021 which decline to USD 4,074 million in Q1 of 2022
and further declined to USD 3,430 million in Q4 of 2022.
As far as India’s imports from China were concerned, the value reported USD 15,424 million in Q1 of 2021 that rose to USD 32,554 million in Q1 of 2022 and that slightly declined to USD 28,639 million in Q4 of 2022. The decline in the last quarter of 2022 may be due to India’s push to ‘Make In India’ initiative that will help the country to manufacture goods in the local market instead of purchasing from China. Get data visualization of India’s trade with China.
|
Quarter |
India Exports to China
(Value USD Million) |
Y-o-Y Comparison % |
India Imports from China
(Value USD Million) |
Y-o-Y Comparison % |
|
2021-Q1 |
4,933 |
- |
15,424 |
- |
|
2021-Q2 |
6,718 |
17.85 |
23,796 |
83.72 |
|
2021-Q3 |
5,142 |
-15.76 |
26,455 |
26.59 |
|
2021-Q4 |
4,187 |
-9.55 |
30,728 |
42.73 |
|
2022-Q1 |
4,074 |
-1.13 |
32,554 |
18.26 |
|
2022-Q2 |
4,818 |
7.44 |
31,784 |
-7.7 |
|
2022-Q3 |
3,419 |
-13.99 |
33,872 |
20.88 |
|
2022-Q4 |
3,430 |
0.11 |
28,639 |
-52.33 |
India’s Top Exports to China 2022
Industry-wise, India exports products under mineral fuels and oils the most to China. Other India’s top exports to China in 2022 were organic chemicals, fish & crustaceans, machinery, mechanical appliances, etc., ores, slag & ash, salt, Sulphur, earths & stones, cereals, animal or vegetable fats & oils, electrical machinery & equipment, and copper & articles. See the chart below to have a proper analysis of India’s top export commodities to China in 2022.

|
Commodity |
Value USD Million |
|
Mineral Fuels and Oils |
1,759 |
|
Organic Chemicals |
1,682 |
|
Fish and Crustaceans |
1,425 |
|
Machinery, Mechanical Appliances, Boilers, etc. |
1,115 |
|
Ores, Slag and Ash |
1,063 |
|
Salt, Sulphur, Earths and Stones |
925 |
|
Cereals |
854 |
|
Animal or Vegetable Fats and Oils |
692 |
|
Electrical Machinery and Equipment |
649 |
|
Copper and Articles |
570 |
India’s Top Imports from China 2022
High imports of Chinese goods could have been driven
by India’s manufacturing sector which is recovering well from the Covid-19
pandemic and other disruptions but continues to depend heavily on critical
intermediates like electronic components and active pharmaceutical ingredients
(API) from China.
India’s top imports from China in 2022 were electrical machinery and equipment, machinery, mechanical appliances, etc., organic chemicals, plastics & articles, optical, photographic, medical equipment, fertilisers, iron and steel, articles of iron and steel, glass and glassware, and natural or cultured pearls and precious stones and metals. See and analyze their values in the given chart.

|
Commodity |
Value USD Million |
|
Electrical Machinery and Equipment |
42,777 |
|
Machinery, Mechanical Appliances, Boilers,
etc. |
25,876 |
|
Organic Chemicals |
15,718 |
|
Plastics and Articles |
6,178 |
|
Optical, Photographic, Medical Equipment |
2,545 |
|
Fertilisers |
2,400 |
|
Iron and Steel |
2,327 |
|
Articles of Iron and Steel |
2,158 |
|
Glass and Glassware |
2,047 |
|
Natural or Cultured Pearls and Precious
Stones and Metals |
1,876 |
India-China Bilateral Trade –
Forecast
According to a market research report, India’s exports to China are expected to rise slightly in 2023 due to an increase in production. India’s imports from China will be relatively similar as India will push the ‘Atmanirbhar Bharat’ initiative further by boosting the local production of goods and reducing dependency on China for imports. Look at the chart below to understand the forecasts of India-China bilateral trade.

|
India-China Bilateral
Trade |
2023 Forecast (USD
Million) |
|
India Exports to China |
16,559 |
|
India Imports from China |
122,883 |
The trade between the two countries continued to boom
despite border tensions following the military standoff in eastern Ladakh in
May 2020. China has continued to remain one of India’s leading trade partners
in recent years. Investment flows from China to India have dampened over the
last two years following India’s revised FDI policy in response to border
skirmishes.