Japan's Copper Ores Import 24% Up YoY, Indonesia Is At Second Rank Now
06 September 2022
Japan's copper imports in 2021 amounted to a
total worth of $12.47 billion, with a spike in the values as compared to 2020.
The total value of imports for copper ores in Japan amounted to a total worth
of $9.30 billion.
This shows a total rise in the value of copper
ores imported from other countries in Japan by $3.1 billion, with a percentage
of about 34%. In 2022, the rise in the imports of copper ores increased once
again, expected to grow considerably more than the growth in 2021.
Japan’s Copper Ore Imports—2020 and 2021
Japan’s copper imports following the year of
COVID-19 (2020) to the values of the ending year 2021 have been featured in the
table below. The quarterly values show the highest values of copper imports in
Q3-2021, with an import value of $3.72 billion.
The imports of copper ores in Japan have
increased considerably, seeing the values in the table below. Japan import data
shown below shows the frequency of imports growing with minor fluctuations
in-between, following the quarters from 2020 to 2021.

|
Japan's Copper Ores Imports – Quarterly |
|
|
Quarter |
Value USD Billion |
|
Q1-2020 |
2.21 |
|
Q2-2020 |
2.18 |
|
Q3-2020 |
2.45 |
|
Q4-2020 |
2.45 |
|
Q1-2021 |
2.73 |
|
Q2-2021 |
3.22 |
|
Q3-2021 |
3.72 |
|
Q4-2021 |
2.78 |
Top Importing Partners for Copper Ores – 2021
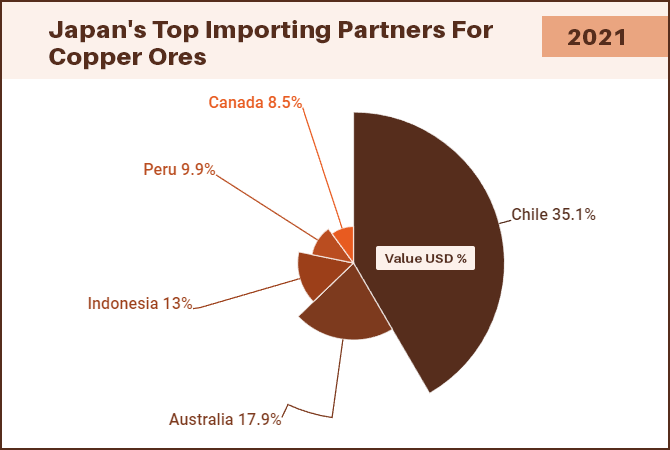
The top importing partners for Japan in the
imports of copper ores are represented in the table below. As per Japan import
data 2021, the top importing partners for Japan’s copper ores in 2021 were –
Chile (35.1%), Australia (17.9%), Indonesia (13%), Peru (9.9%), Canada (8.5%).
|
Japan's Top Importing Partners For
Copper Ores (2021) |
|
|
Country |
Value USD % |
|
Chile |
35.1 |
|
Australia |
17.9 |
|
Indonesia |
13.0 |
|
Peru |
9.9 |
|
Canada |
8.5 |
Top Importing Partners – YoY Comparison
Japan’s import values for top ranking
importing partners are shown below to rank accordingly. The comparison of the
ranking of all the countries shows the growth in a particular country’s
exports. The taken time period for comparison is the second quarter of 2021 and
2022.
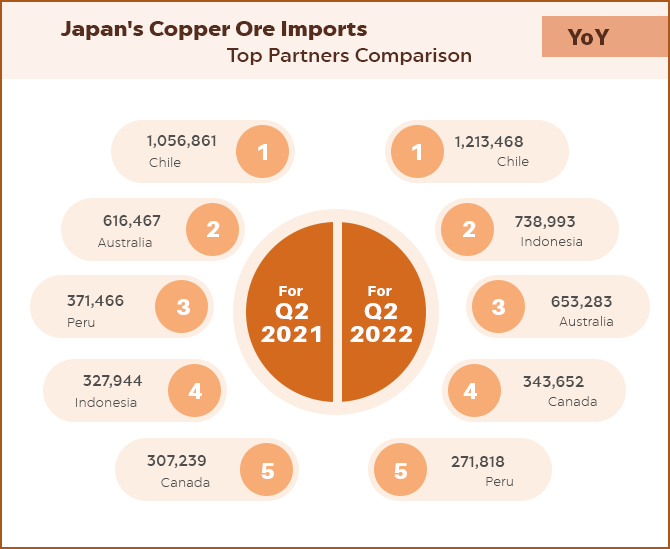
Chile has managed to still rank at the top position with an import value of $1 billion and $1.2 billion. Australia ranked in second place in Q2-2021 with an import value of $616.4 million. In Q2-2022, Australia got dragged down by Indonesia as it took the spot of second-ranking ($653.2 million).
Indonesia, which ranked in fourth place in
Q2-2021 ($327.9 million), ranked second place in Q2-2022 ($738.9 million). Peru
was ranked 3rd in Q2-2021 ($371.4 million), while 5th in Q2-2022 ($271.8
million). Canada ranked 5th in Q2-2021 ($307.2 million) but ranked 4th in
Q2-2022 ($271.8 million).
Copper Ore Imports 2022 – YoY Comparison
The year-on-year comparison evaluated below
represents the value of imports Japan accounted for and hence, evaluates the
amount of growth in the imports. The time period for the first and second
quarters of 2021 and 2022 to have a comparison, has been taken into account.
Japan’s copper imports in Q1-2021 amounted to
$2.7 billion and $3.2 billion in the next following quarter (Q2-2021). The
total value of imports for both quarters amounted to $5.96 billion respectively.
Japan imports 2022 show that the total amount
of imports for copper ores in Q1-2022 amounted to $3.3 billion and $3.8 billion
in the next quarter (Q2-2022). The total imports for both quarters amounted to
$3.8 billion respectively.
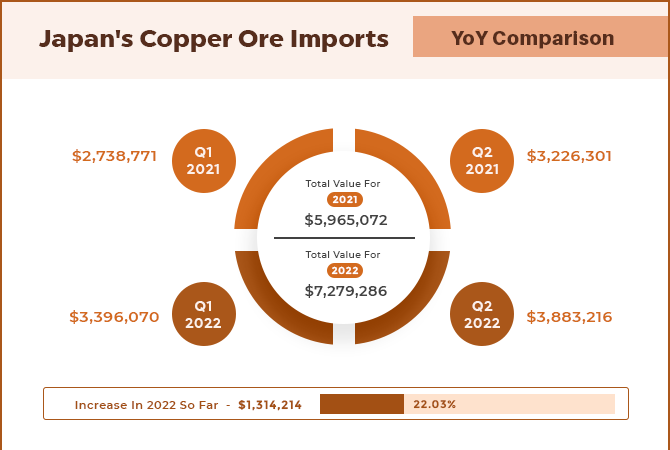
This shows a growth in the value of imports
for copper imports in Japan, with a value difference of $1.3 billion in the
total import values of 2021 and 2022. The increase in the import values for
2022 as compared to the values of 2021 shows a percentage increase of 22.03%.
The important point to consider is the value
of imports for two quarters shows a rise in the imports by 22.03%. This gives a
presumption that if imports continue to increase in 2022, the growth might be
more significant than what it showed in 2021 compared to 2020.