Netherlands Exports Frequent High Surges Since COVID-19 Inception In 2020
29 October 2022

The Netherlands is a relatively small country with
near about 17 million inhabitants, making it the second largest densely
populated country in the European Union and considered the sixteenth largest
populated country in the world. Despite being a small country that the country
is regarded as, the exports of the Netherlands have skyrocketed since the
inception of the pandemic, COVID-19, which struck the world in near about March
2020 and was discovered at the beginning of 2020.
Netherlands
Exports – Historical
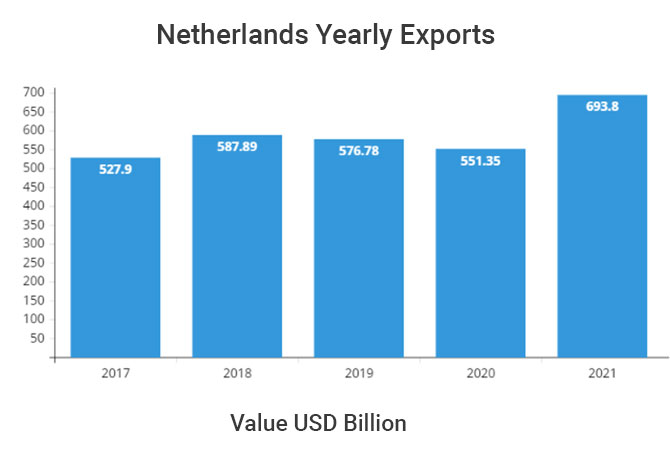
The yearly exports of the Netherlands featured below show the total value of exports registered in the past five years. In 2017, the exports amounted to $527.9 billion, followed by $587.8 and $576.7 billion in 2018 and 2019 respectively. 2020 amounted to $551.3 billion and $693.8 billion in 2021. As evident in the shown data, the exports in 2021 surged significantly higher than in 2020.
|
Netherlands Yearly
Exports |
|
|
Year |
Value USD Billion |
|
2017 |
527.90 |
|
2018 |
587.89 |
|
2019 |
576.78 |
|
2020 |
551.35 |
|
2021 |
693.80 |
Netherlands Top
Export Partners
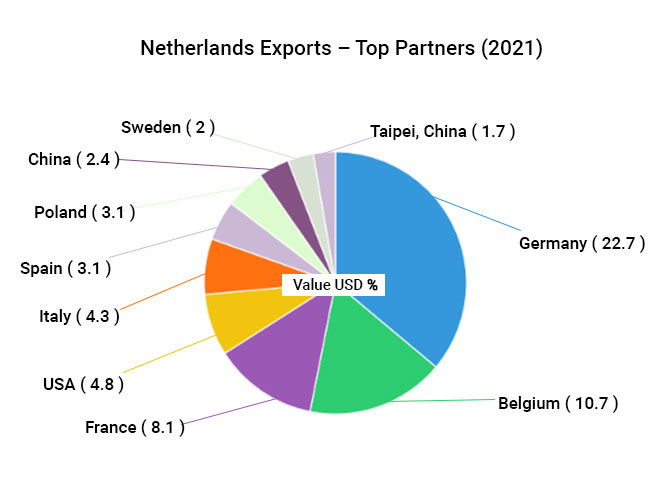
As per the Netherlands export data 2021, the top export partners for the Netherlands are—Germany (22.7%), followed by Belgium (10.7%), France (8.1%), the USA (4.8%), Italy (4.3%), Spain (3.1%), Poland (3.1%), China (2.4%), Sweden (2%), and Taipei, Chinese (1.7%).
|
Netherlands Exports
– Top Partners (2021) |
|
|
Country |
Value USD % |
|
Germany |
22.7 |
|
Belgium |
10.7 |
|
France |
8.1 |
|
United States of America |
4.8 |
|
Italy |
4.3 |
|
Spain |
3.1 |
|
Poland |
3.1 |
|
China |
2.4 |
|
Sweden |
2 |
|
Taipei, Chinese |
1.7 |
Netherlands
Commodities’ Exports
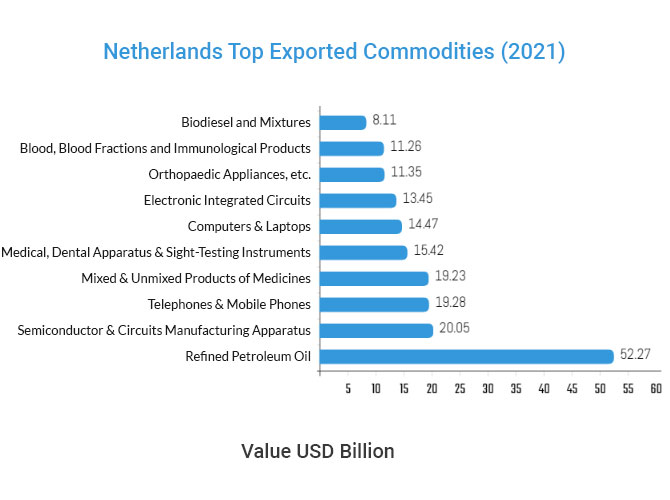
These are the top 10 exports of the Netherlands - Refined Petroleum ($52.2 billion), followed by Semiconductor Manufacturing Apparatus ($20 billion), Phones ($19.2 billion), Mixed/Unmixed Medicines ($19.2 billion), Medical & Other Apparatus ($15.4 billion), and other top exported commodities as shown in the Netherlands exports 2021.
|
Netherlands Top
Exported Commodities (2021) |
|
|
Commodities |
Value USD Billion |
|
Refined Petroleum Oil |
52.27 |
|
Semiconductor & Circuits
Manufacturing Apparatus |
20.05 |
|
Telephones & Mobile Phones |
19.28 |
|
Mixed & Unmixed Products of
Medicines |
19.23 |
|
Medical, Dental Apparatus &
Sight-Testing Instruments |
15.42 |
|
Computers & Laptops |
14.47 |
|
Electronic Integrated Circuits |
13.45 |
|
Orthopedic Appliances, etc. |
11.35 |
|
Blood, Blood Fractions and Immunological
Products |
11.26 |
|
Biodiesel and Mixtures |
8.11 |
Netherlands
Exports – Quarterly Trend
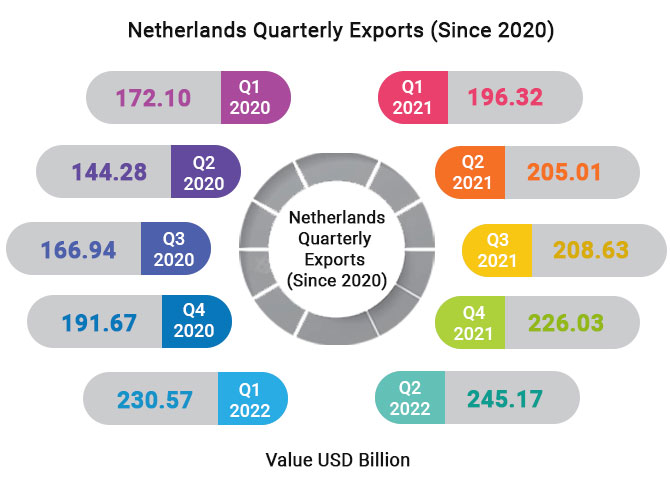
The quarterly exports of the Netherlands are featured below, ranging from the first quarter of 2020 to the second quarter of 2022, representing the export trend till now, as per available data. The first quarter of 2020 amounted to $172.1 billion when COVID-19 was only discovered.
|
Netherlands
Quarterly Exports (Since 2020) |
|
|
Quarter |
Value USD Billion |
|
Q1-2020 |
172.10 |
|
Q2-2020 |
144.28 |
|
Q3-2020 |
166.94 |
|
Q4-2020 |
191.67 |
|
Q1-2021 |
196.32 |
|
Q2-2021 |
205.01 |
|
Q3-2021 |
208.63 |
|
Q4-2021 |
226.03 |
|
Q1-2022 |
230.57 |
|
Q2-2022 |
245.17 |
In March 2020, it struck the world and countries
struggled to grapple out of it. Hence, in Q2-2020, the exports amounted to
$144.2 billion, showing a downward trend with a percentile decrease of 16%,
followed by an increase of 15.7% in the next following quarter (Q3-2020).
Following the third quarter of 2020, till the second
quarter of 2022, the exports have grown frequently in the following trend: Q4-2020
(14.8%), Q1-2021 (2.4%), Q2-2021 (4.4%), Q3-2021 (1.7%), Q4-2021 (8.3%),
Q1-2022 (2%), and Q1-2022 (6.3%).