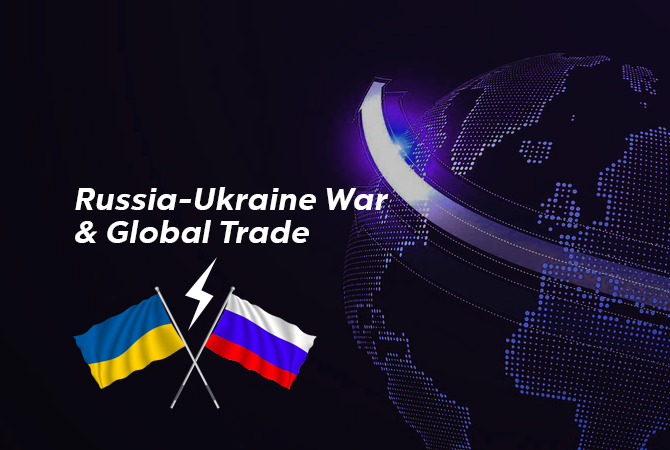
Russia’s Invasion of Ukraine Could Shake Global Trade Blocs
22 June 2022
Key Points
·
Russia-Ukraine
war forced countries to think of alternative trading partners.
·
Russian
military blocked Black Sea, resulting millions of wheat stuck in Ukraine.
·
Any
change in global trade would benefit Asia, Latin America, and Africa.
First, it was the Covid-19 pandemic. Then came the
Russia-Ukraine war. With two major global crises back to back, the supply chain
of commodities has been disrupted and it is unlikely to get on track until at
least the end of the year. The war in Ukraine, in particular, has caused
countries to think about the need for more dependable trading partners. Here’s
an overall analysis of the Russia-Ukraine war’s impact on global trade blocs.
Trade Blocs
The first bloc would comprise of European Union, the
United States, and their allies who have slapped sanctions on Russia and are
aligned in isolating Russia. Those allies could include the United Kingdom and
Japan. The second bloc may be countries that will seek to straddle both sides.
There would be a bloc of countries like India and China that maintain trade
with both the sanctioning allies and Russia. They need to create a balance
between Russia, dependent on Russian energy products, and large economies in
the first bloc which account for a significant proportion of their export
demand.
Trade Routes
Russia’s invasion of Ukraine has impacted trade routes
by both land and sea and the volumes passing along them. Since the war started,
shippers have avoided the Black Sea, where Russia’s military activity has
blocked commercial shipping. That’s caused congestion in other ports in Europe
because shippers have had to change their routes.
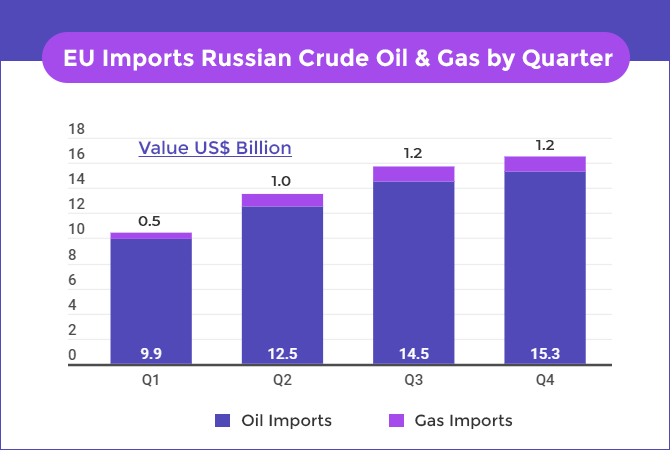
EU Imports Russian Crude Oil and
Gas by Quarter
Energy prices soared this year as Russia’s onslaught
in Ukraine destabilized the markets and Western countries slapped sanctions on
Moscow. The European Union has agreed to ban 90% of Russian oil imports by end
of the year. According to our database, the EU nations imported US$52.4 billion
worth of crude oil from Russia in 2021, an increase from US$35.0 billion reported
in 2020.
The European Union receives about 40% of its natural
gas from Russian pipelines and about a quarter of that flows through Ukraine. Our
online platform covering essential data shows that the EU countries imported
Russian gas worth US$4.1 billion in 2021. That dollar amount increased from
US$3.2 billion reported in 2020. Here’s a quick analysis of the EU’s imports of
Russian crude oil and gas by a quarter in data visualization.
|
Quarter |
Oil Imports (Value US$
Billion) |
Gas Imports (Value US$
Billion) |
|
Q1 |
9.9 |
0.5 |
|
Q2 |
12.5 |
1.0 |
|
Q3 |
14.5 |
1.2 |
|
Q4 |
15.3 |
1.2 |
Crucial grain exports such as wheat have also been
affected. Millions of tons of wheat from Ukraine, one of the world’s biggest
wheat exporters, have been stuck in the country, unable to get to countries
that need them. That’s because Russia’s military forces have been blocking the
Black Sea, where key Ukrainian ports are. According to the market intelligence
reports, before the war, Ukrainian Black Sea ports accounted for around 90% of
its grain exports. So, the global economy becomes more regionalized – shorter
supply chains with reliable partners.
Winners and Losers
The changes in global trade due to the Russia-Ukraine
war would cause some economies to benefit, such as Asia, Latin America, and
Africa. Exports will be diverted requiring new markets to be found for
commodities, and logistics put in place to accommodate the new trade flows. Routes
could change and many benefit some Asian countries such as Vietnam, where more
companies are already manufacturing their goods.
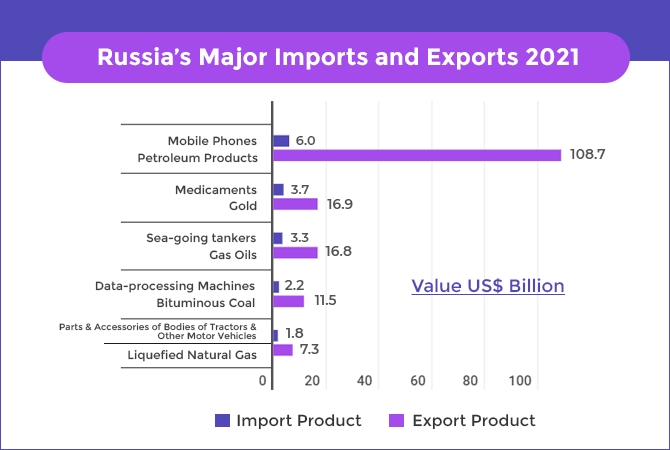
Russia would likely be the biggest loser as it can
pivot some trade links and will become excluded from a large proportion of the
global economy. Take a look at Russia’s top imports and exports reported in
2021.
|
Import Product |
Value US$ Billion |
Export Product |
Value US$ Billion |
|
Mobile Phones |
6.0 |
Petroleum Products |
108.7 |
|
Medicaments |
3.7 |
Gold |
16.9 |
|
Sea-going tankers |
3.3 |
Gas Oils |
16.8 |
|
Data-processing Machines |
2.2 |
Bituminous Coal |
11.5 |
|
Parts & Accessories of Bodies of
Tractors & Other Motor Vehicles |
1.8 |
Liquefied Natural Gas |
7.3 |
Singapore would also lose out as shippers go from the
emerging manufacturing hubs of Vietnam and Cambodia directly to the U.S. West
Coast.
Overall, it is expected that there will be a lower reliance on the Big East-West trade routes between China and Europe, as well as China and the United States. So, we have to wait and watch how long this Russia-Ukraine war will continue and analyze its impact on the global supply chain.