The US Accounted For The Highest Jump In Iron & Steel Imports in 2021
13 September 2022

The US iron and steel production accounts for
about 4-6% of global crude steel production. The consumption of domestic steel
is also higher, leading to the high amount of iron and steel imports from the
US.
According to the import data of the US, the
year 2021 accounted for the highest value of imported iron and steel in the
past decade. The values also show a frequent surge in the imports of iron and
steel to the US.
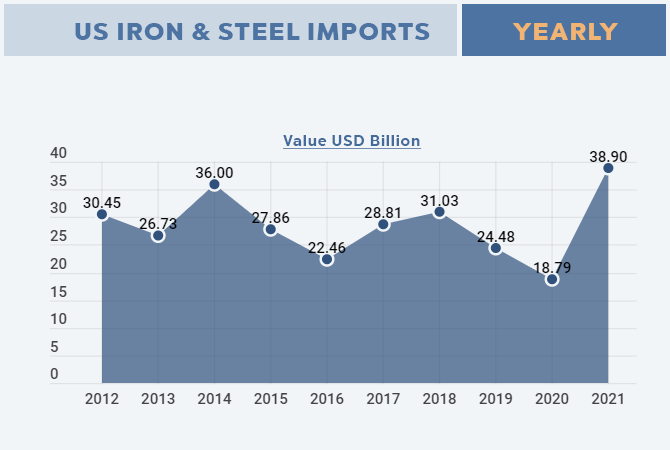
US Iron & Steel Historical Imports
The imports of the US’s iron and steel
featured below show yearly values, from 2012 to 2021. The US’s iron and steel
imports for 2013-14 accounted for a decline of 12.2% compared to the 2011-12
period. Following minor fluctuations, imports registered a value of $38.9
billion in 2021.
|
US Iron & Steel Imports – Yearly |
|
|
Year |
Value
USD Billion |
|
2012 |
30.45 |
|
2013 |
26.73 |
|
2014 |
36.00 |
|
2015 |
27.86 |
|
2016 |
22.46 |
|
2017 |
28.81 |
|
2018 |
31.03 |
|
2019 |
24.48 |
|
2020 |
18.79 |
|
2021 |
38.90 |
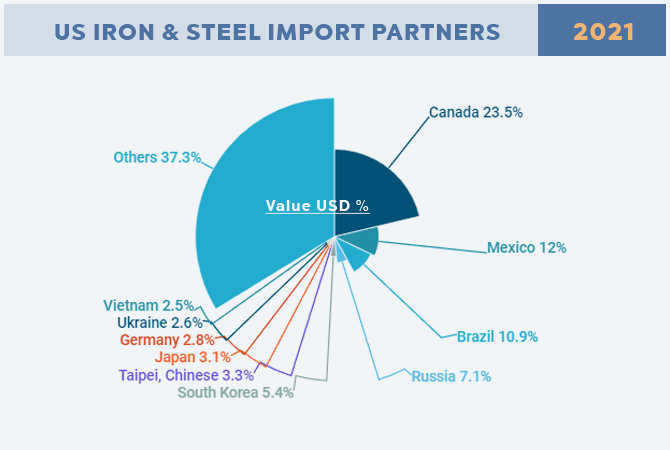
US Top Importing Partners, 2021
The top importing partners for the US in iron
& steel imports are—Canada with a share value of 23.5%, followed by Mexico
with 12%, Brazil with 10.9%, Russia with 7.1%, South Korea with 5.4%, Taipei,
Chinese with 3.3%, Japan with 3.1%, Germany with 2.8%, Ukraine with 2.6%, and
Vietnam with 2.5%.
|
US Iron & Steel Import Partners
(2021) |
|
|
Country |
Value
USD % |
|
Canada |
23.5 |
|
Mexico |
12 |
|
Brazil |
10.9 |
|
Russia |
7.1 |
|
South
Korea |
5.4 |
|
Taipei, Chinese |
3.3 |
|
Japan |
3.1 |
|
Germany |
2.8 |
|
Ukraine |
2.6 |
|
Vietnam |
2.5 |
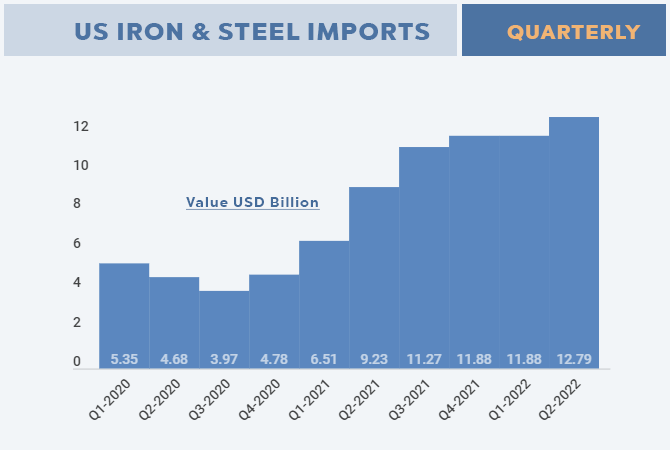
Growth of Iron & Steel Imports
The imports of iron and steel in the US
following the year of 2020 to 2022 is shown on a quarterly basis in the table
below. The represented US import data 2022 provides insight into the import
trends of the US in importing iron and steel so far.
|
US Iron & Steel Imports –
Quarterly |
|
|
Quarter |
Value
USD Billion |
|
Q1-2020 |
5.35 |
|
Q2-2020 |
4.68 |
|
Q3-2020 |
3.97 |
|
Q4-2020 |
4.78 |
|
Q1-2021 |
6.51 |
|
Q2-2021 |
9.23 |
|
Q3-2021 |
11.27 |
|
Q4-2021 |
11.88 |
|
Q1-2022 |
11.88 |
|
Q2-2022 |
12.79 |
The first quarter of 2020 accounted for a
total import value of $5.3 billion, followed by $4.6 billion in Q2-2020. In
Q3-2020, the imports fell down to the value of $3.9 billion, accounting for a
decline by a percentage of 15%. The next quarter registered an increase of
20.3% with a total import value of $4.7 billion.
The first quarter of 2021 accounted for the
import value of $6.5 billion, followed by the second quarter amounting to $9.2
billion, $11.2 billion in the third quarter, and settling down at the highest
value in the year with $11.8 billion in the last quarter, showing an increase
of 5.4%.
The first quarter of 2022 amounted to an
increase of 0.02%, according to the import data 2022, showing a minor increase
as compared to the previous quarter. The next following quarter (Q2-2022)
registered a total value of $12.7 billion, showing an increase of 7.6%.