Trade Balance of Indonesia – Exports & Imports Rise in First Half 2022
09 December 2022
Despite a high degree of global economic uncertainty
due to the Russia-Ukraine war, Indonesia’s export, and import performance has
been very strong thanks to high international commodity prices, and the
economic rebound from the Covid-19 crisis. So, the year 2022 so far has been
positive for Indonesian trade as the country’s exports and imports increased in
the first half of this year. Month-wise, Indonesian trade saw a surge in August
as compared to the previous months. Here is an overview of Indonesia’s exports
and imports in 2022.
Indonesia’s exports recorded a good
rise and imports saw a marginal increase in Q2 of 2022
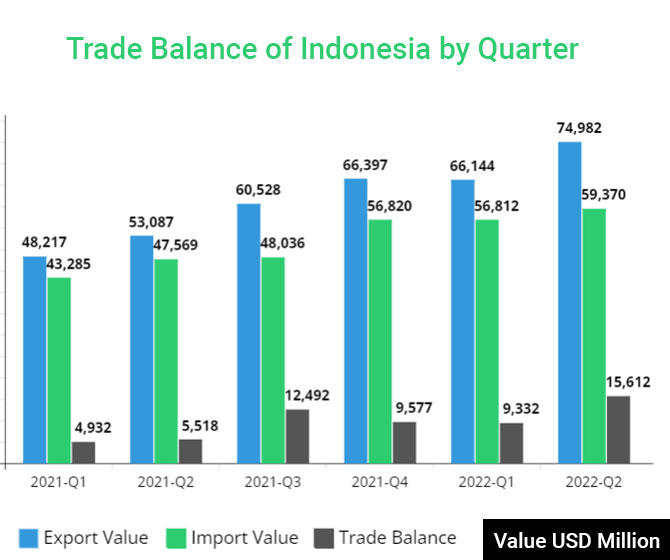
Indonesia’s exports have increased substantially in the
first half of 2022 and imports also increased marginally in the said period. The
trade balance of Indonesia has been positive from Q1 of 2021 to Q2 of 2022, as
per our Indonesia trade data. Below given chart shows the trade balance of
Indonesia and the table shows the value of Indonesian exports and imports.
|
Quarter |
Export Value (USD
Million) |
Import Value (USD
Million) |
Trade Balance (USD
Million) |
|
2021-Q1 |
48,217 |
43,285 |
4,932 |
|
2021-Q2 |
53,087 |
47,569 |
5,518 |
|
2021-Q3 |
60,528 |
48,036 |
12,492 |
|
2021-Q4 |
66,397 |
56,820 |
9,577 |
|
2022-Q1 |
66,144 |
56,812 |
9,332 |
|
2022-Q2 |
74,982 |
59,370 |
15,612 |
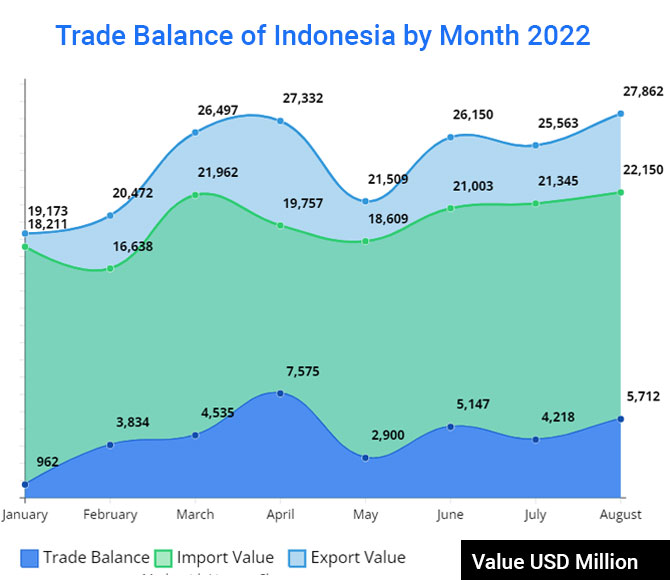
Indonesian exports and imports
increased in August 2022
By month, Indonesia has recorded a good surge in
exports in August 2022 and imports also rose marginally in the said month. The
trade balance of Indonesia increased from USD 962 million in January 2022 to
USD 5,712 million in August. Here is a data visualization of Indonesian trade
from Jan to Aug 2022 and a table that shows the value of exports and imports as
well.
|
Month |
Export Value (USD
Million) |
Import Value (USD
Million) |
Trade Balance (USD
Million) |
|
January |
19,173 |
18,211 |
962 |
|
February |
20,472 |
16,638 |
3,834 |
|
March |
26,497 |
21,962 |
4,535 |
|
April |
27,332 |
19,757 |
7,575 |
|
May |
21,509 |
18,609 |
2,900 |
|
June |
26,150 |
21,003 |
5,147 |
|
July |
25,563 |
21,345 |
4,218 |
|
August |
27,862 |
22,150 |
5,712 |
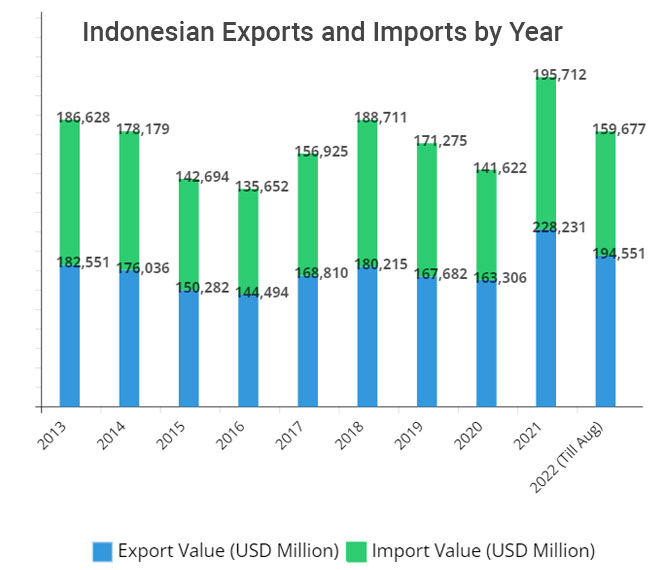
Year-wise analysis of Indonesian
exports and imports
Despite the Covid-19 pandemic crisis and global economic uncertainties, Indonesia’s trade has increased in the last ten years. According to our data, Indonesia’s exports in 2013 were USD 182,551 million which rose to USD 228,231 million in 2021. And imports were USD 186,628 million in 2013 and USD 195,712 million in 2021. Till August 2022, Indonesia exported USD 194,551 million worth of commodities and imported USD 159,677 million worth of goods. Take a look at the chart to get better data visualization.
|
Year |
Export Value (USD
Million) |
Import Value (USD
Million) |
|
2013 |
182,551 |
186,628 |
|
2014 |
176,036 |
178,179 |
|
2015 |
150,282 |
142,694 |
|
2016 |
144,494 |
135,652 |
|
2017 |
168,810 |
156,925 |
|
2018 |
180,215 |
188,711 |
|
2019 |
167,682 |
171,275 |
|
2020 |
163,306 |
141,622 |
|
2021 |
228,231 |
195,712 |
|
2022 (Till Aug) |
194,551 |
159,677 |
Indonesia is likely to see a strong economy in 2023, despite the global trade crisis due to the ongoing Russia-Ukraine war and the aftermath of the Covid-19 pandemic. Keep on trusting us to access accurate and complete global import-export trade data. We will keep updating Indonesia’s trade data and trade information of other countries.