Denmark Import Data is a statistical type of data and covers 5200000+ shipment records. It is based on Shipping Bills, Import Bills, Invoices and other import-export documents.
We collect Denmark trade data from Custom Departments, Shipping & Logistics Companies, Trade Associations and Government Bodies. We have Denmark shipment data available from 2013 onwards.
Denmark import data contains fields including Period, Import Country, Origin Country, Trade Type, HS Code, HS Code Description, State Regime, Unit, Total Value ERU, Total Value USD, Quantity KG and Sub-Quantity. Here is a sample of Denmark imports and understand data format.

| Period | 2020-02 | ||
|---|---|---|---|
| Import Country | Denmark | Origin Country | Germany |
| Trade Type | Intra Trade | HS Code | 85016120 |
| HS Code Description | Ac Generators "Alternators", Of An Output <= 7,5 Kva | ||
| State Regime | Normal | Unit | Number Of Items |
| Total Value ERU | 133 | Total Value USD | 156.18 |
| Quantity KG | 30 | Sub-Quantity | 1 |
As per Denmark import data, Denmark’s top 10 imports in 2020 were Machinery (13.4%), Electrical Machinery & Equipment (10.4%), Vehicles (8.3%), Pharma Products (5.5%), Mineral Fuels & Oils (4.5%), Plastics & Articles (4.0%), Optical, Photographic, Medical Equipment (3.0%), Fish and Crustaceans (3.0%), Articles of Iron and Steel (2.8%) and Furniture, Bedding and Mattresses (2.7%).
Denmark trade data shows Denmark’s top 10 import commodities accounted for 57.6% to overall value of shipments in 2020. As per Denmark shipment data, Fish posted the fastest growth in cost among Denmark’s top 10 import categories, up 31.7% from 2019 to 2020. Two top categories declined year over year, namely mineral fuels including oil (down -32.4%) and vehicles (down -2.5%). Visualize dollar amount of Denmark’s top 10 import categories recorded in 2020.

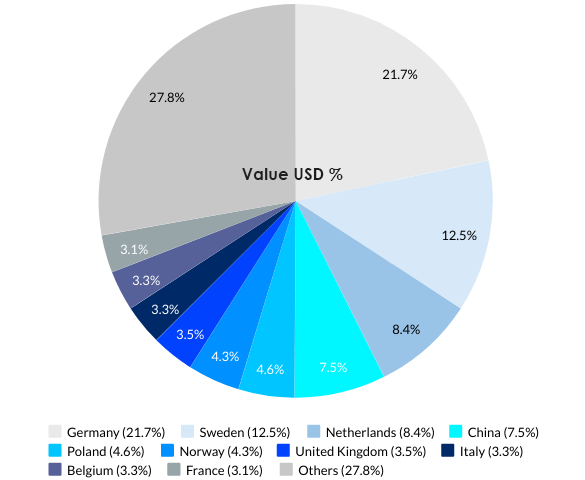
Germany (USD 21.1 billion), Sweden (USD 12.1 billion), Netherlands (USD 8.2 billion), China (USD 7.3 billion), Poland (USD 4.4 billion), Norway (USD 4.1 billion), United Kingdom (USD 3.4 billion), Italy (USD 3.2 billion), Belgium (USD 3.1 billion) and France (USD 3.0 billion).
As per Denmark import statistics, Denmark’s top 10 import partners in 2020 accounted for 72.2% to overall value of shipments enter into the country through all modes of transport. Based on Denmark shipment data, about 80% of Denmark’s total imports by value in 2020 were purchased from fellow European countries. Asian trade partners supplied 14% of imports purchased by Denmark. Below given chart shows value in percentile of Denmark’s top 10 import sources reported in 2020.