 Colombia export data shows total exports for 2020 with a value of (approx.) $31 Billion. Colombia exports 2019 shows the (approx.) value of $39 Billion, according to the Colombia trade data. As per International trade data and trade data of Colombia, ranking of Colombia among the top exporters of the world is at 55th position.
Colombia customs data show that major exports of the country were ‘Mineral Fuels & Oils’. Whereas, the top exporting partner of Colombia is the ‘United States of America’, as per Colombia export data representing Colombia export statistics. Looking at the Colombia trade statistics, the values of exports as per product and the country, are highest among each of their respective fields. This can be examined and understood through the export data of Colombia.
Export Genius provides Colombia customs data in the form of Colombia shipment data. The shipment data provided by Export Genius plays an important role for any business to obtain an authentic image of the Colombia export data. Let us show you what kind of data we provide and why the export statistics of Colombia play an important role in your business. Meanwhile, you can request for sample data or you can do a live search.
The Colombia shipment data we provide represents all the shipment details about the outbound shipments for any particular product. The shipment data consists of various fields related to Colombia customs data. The major fields are - Date, Product Description, HS Code, Destination Country, Quantity, Unit, Total Value USD, Port Name, etc.
The information(s) we provide is sourced from authorized Customs Departments, Trade Associations, Government Bodies, Shipping & Logistics Companies, Port Authorities and other authoritative links. Colombia export data is available from January 2008 to present. Total number of Colombia shipment records present in our database are 9,00,000+ and total importers are 10,000+.
Colombia shipment data on the right hand side consist of different fields and these fields give the information on Colombia customs data about any particular country and even product. The fields give us information about the kind of transportation used to export, exporter & buyer names and their addresses, destination country along with the product’s description and details on its quantity and value. Colombia export data on the right hand side features all these fields.

| Date | 5-June-2020 | ||
|---|---|---|---|
| Exporter Name | ***** | Exporter Address | ***** |
| Buyer Name | ***** | Buyer Address | ***** |
| Destination Country | Chile | Quantity | 5000 |
| HS Code | 3926200000 | ||
| HS Code Description | Garments and accessories, of clothing, including gloves, mittens and mittens | ||
| Weight | 205.45 | Unit | KG |
| Total Value (USD) | 7432.33 | Transport Mode | Sea |
| Port of Loading | Cartagena | ||
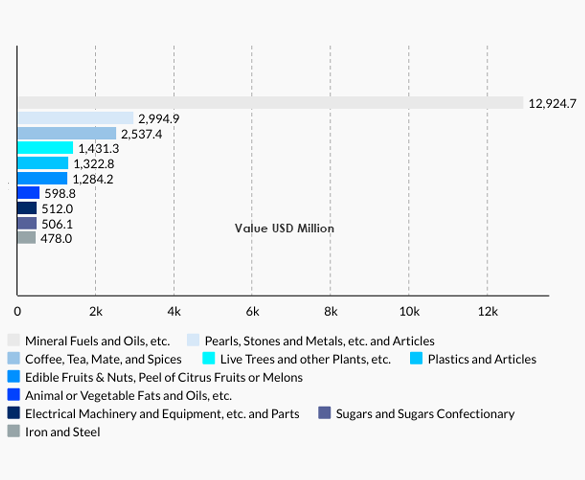
Colombia main exports 2020 are Mineral Fuels and Oils ($12,924.7 million total exports), Pearls and Metals ($2,994.9 million total exports), Coffee and Spices ($2,537.4 million total exports), Live Trees and Plants ($1,431.3 million total exports), Plastics and Articles ($1,322.8 million total exports), Edible Fruits & Nuts ($1,284.2 million total exports), Fats & Oils ($598.8 million total exports), Electronics ($512 million total exports), Sugar ($506.1 million total exports), Iron and Steel ($478 million total exports) as per the export statistics of Colombia on the right side.
According to the trade statistics of Colombia, the main exports were for ‘Mineral Fuels & Oils’. While the least exported product is ‘Iron and Steel’. Through the Colombia trade data, we can conclude that the businesses dealing in the first sector have chances of good fortunes and better outcomes compared to businesses in the other sector. Low demand factors of this sector can be studied through Colombia export data.
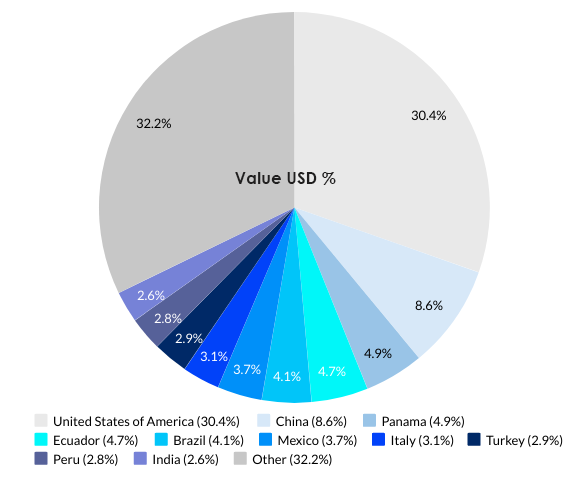
Colombia’s main export partners are United States of America with a share of 30.4% ($9,442 Million), China with a share of 8.6% ($2,670 Million), Panama with a share of 4.9% ($1,510.5 Million), Ecuador with a share of 4.7% ($1,473.6 Million), Brazil with a share of 4.1% ($1,274 Million), Mexico with a share of 3.7% ($1,161 Million), Italy with a share of 3.1% ($961.2 Million), Turkey with a share of 2.9% ($915.1 Million), Peru with a share of 2.8% ($854.2 Million), India with a share of 2.6% ($795.1 Million), according to the Colombia export data 2020.
Colombia customs data shown on the left side shows that the USA export value are remarkably high. Because Colombia exports mineral fuels & oils, pearls & stones, live trees & plants and coffee & spices the most to the USA. Look at the Colombia trade data and observe.